Research Areas
- Subsonic and supersonic turbulent mixing in chemically-reacting and non-reacting shear-layer
flows, at high Reynolds number, with fluids of various Schmidt numbers (gases and liquids).
- A study of mixing and the geometry of surfaces and interfaces in turbulence, focusing on
extensions of the original fractal ideas.
- Aerooptical effects in turbulent flows, with applications to the study of atmospheric
turbulence, imaging through and laser beam propagation in the atmosphere, adaptive optics,
and ground-based astronomy.
- Hydrocarbon ignition and combustion in high-speed flows, with applications to supersonic
combustion, hydrocarbon-fueled scramjets, and high-speed (hypersonic) flight.
- Development of Image Correlation Velocimetry (ICV) methods, permitting the measurement of
the convecting velocity field from a succession of images of Lagrangian markers, such as
particle tracers or continuous scalars.
- High-speed and three-dimensional digital imaging and visualization in turbulent flows and
other phenomena. A multi-pronged effort with developments in high rep-rate pulsed lasers;
fast, high-resolution CCD arrays; high-speed data acquisition, image processing, and computer
visualization.
- Numerical simulation of high-speed flows using Riemann-Invariant-Manifold (RIM) methods,
leading to numerical schemes requiring no operator splitting.
- Direct numerical simulation (DNS) of compressible- and incompressible-turbulence phenomena.
- Dispersion and mixing in compressible, high-speed turbulent flows using large-eddy
simulation with sub-grid scale (LES-SGS) modeling.
Subsonic and supersonic turbulent mixing in chemically reacting and non-reacting shear flows
This is an experimental, numerical-simulation, and theoretical program in chemically-reacting and nonreacting, high Reynolds number, free-shear flows. The experiments are conducted in a variety of facilities, such as,
- GALCIT Supersonic Shear Layer (S3L) facility,
- Variable-Pressure Flow (VPF) and Combustion Facility,
- GALCIT Hydrolab Free Surface Water Tunnel (FSWT),
- Jet Flow Visualization (JFV) facility,
- as well as other smaller, custom-designed test facilities.
In this work, we are investigating compressible and incompressible turbulence and turbulent mixing, turbulence-generated unsteady-wave phenomena, turbulent large-scale behavior, as well as Reynolds number (viscous) and Mach number (compressibility) effects.
The high-speed experiments are conducted in the S3L facility, with a near-atmospheric-pressure test
section, permitting the fast chemical kinetics of such reactants as hydrogen and fluorine to be
used as a molecular probe to infer the extent of molecular mixing under high Reynolds number
extending to supersonic-flow conditions. Other experiments in gas-phase flows are conducted in the
Variable-Pressure Flow (VPF) facility where Reynolds number effects in jet flows have been
investigated, as well as experiments on aero-optical effects. Comparison of these experiments
with work in liquid-phase flows have been used to investigate Schmidt-number effects, as well
as exploit the special capabilities of liquid-phase-flow facilities and diagnostics such as
laser-induced fluorescence (LIF) techniques.
Composite color-schlieren image of reacting turbulent shear-layer flow. Upper (high-speed) freestream is a mixture containing hydrogen. Lower (low-speed) freestream contains fluorine. Shear-layer (local) Reynolds number at right edge is equal to 2x10⁵. Tripped inflow high-speed boundary layer (Slessor, Bond, and Dimotakis 1998, Fig. 8b.)
Supported by: the Air Force Office of Scientific Research.
[References] | [Back to the top]
Mixing and the geometry of surfaces and interfaces in turbulence
Laser-scattering imaging techniques permit the resolution of the full-range of velocity and scalar scales, in both liquid- and gas-phase flows, for values of the Reynolds number that are of interest to the study of fully-developed turbulent flows. Digital CCD-image-array detection, coupled with image-processing methods, make it possible to trace the interface between fluids mixed by turbulence. Such data allow quantitative measures of this process to be computed. We are interpreting the statistical geometric behavior and topology of such interfaces using extensions of the original fractal notions to scale-dependent behavior and other appropriate descriptions. This is important in the context of turbulent mixing, chemical reactions, and combustion, in that such laws permit a calculation of the surface-to-volume ratio of the interfaces on which (molecular diffusion) mixing is taking place, for example, as well as other geometric statistics.
In addition to their application in the analysis and interpretation of experimental data,
these methods are currently being applied to the analysis of the results of three-dimensional,
direct numerical simulations (DNS) by A. Cook, of unsteady flows generated by the Rayleigh-Taylor
instability, currently in progress on the Lawrence Livermore Pacific-Blue computer, as well as DNS
data by Ravi Samtaney (NASA/AMES), of Richtmyer-Meshkov instability (in progress).
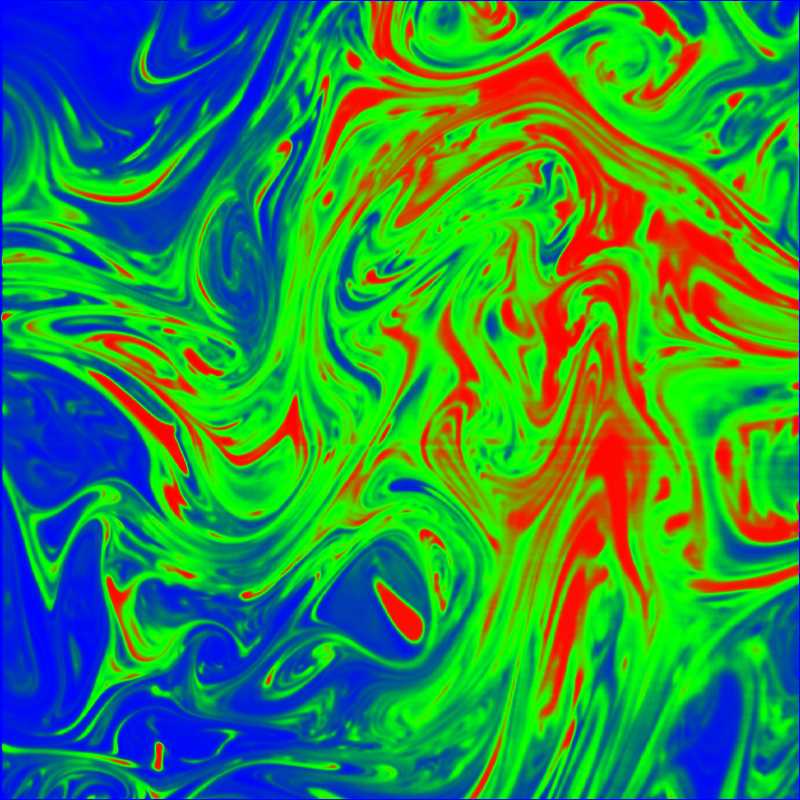
Space-time (x,y,t) LIF image in the far-field of a turbulent jet (x/d=275). Jet Reynolds number, Rejet = 9000. Measurements by H. Catrakis and P. Dimotakis. Computer visualization by D. Laidlaw [Dimotakis & Catrakis 1996a].
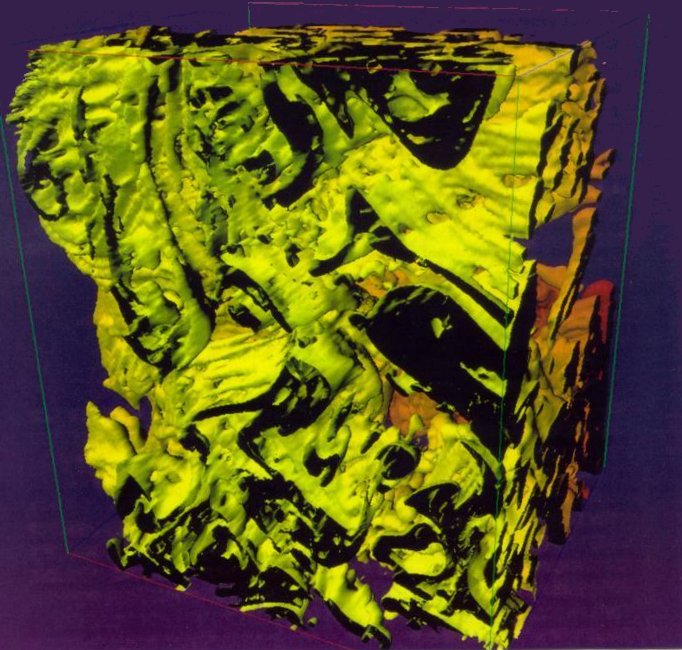
Iso-concentration surface (x,y,z) of a 352 x 4.5 mm3 slab in the turbulent-mixing region in the wake of a spoon. Imaged by 3D LIF, concentrations below the chosen scalar threshold are shown transparent. Three-dimensional measurements and surface rendering by S. Deusch (1998).
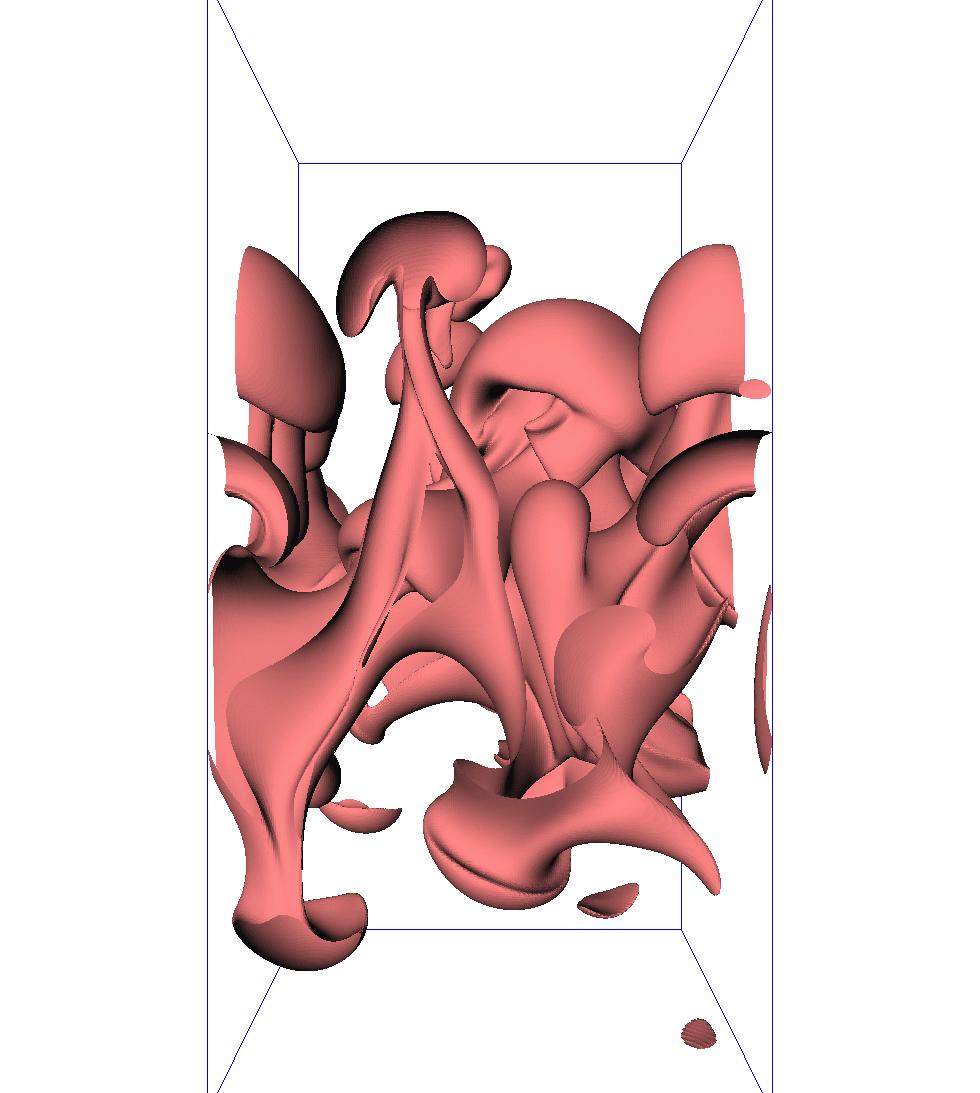
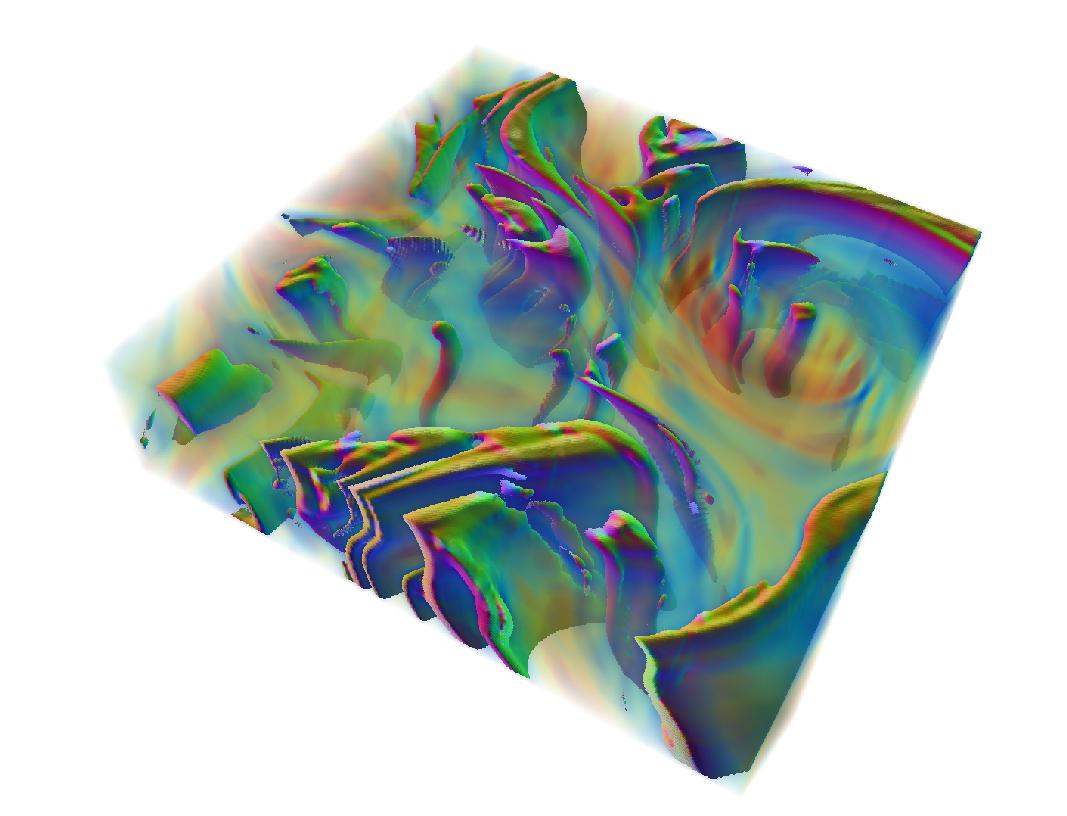
Iso-concentration surface in a flow driven by the Rayleigh-Taylor instability (fluid density ratio = 3:1; Atwood number = 1/2). Direct Numerical Simulation (DNS) by A. Cook. Computer visualization by S. Deusch and P. Dimotakis.
Supported by: the Air Force Office of Scientific Research and the Department of Energy (Caltech ASCI/ASAP program).
[References] | [Back to the top]
Aerooptical effects in turbulent flows
The interaction of optical beams and turbulence is relevant to our understanding and control of problems in long-range imaging and focusing through the atmosphere from stationary objects, such as from ground-based astronomical telescopes, as well as from high-speed aircraft. As long as the laser-beam flux is not too high, laser-beam propagation and imaging entail the same physics.
Research is in progress in atmospheric- as well as elevated-pressure, gas-phase turbulent, subsonic and supersonic free-shear flows, using gases with different indices of refraction (and laser-scattering cross-section) to study the effect of turbulence on optical/laser beam distortion and propagation. The high-pressure environment provides us with a large enough number density of molecular scatterers to permit both the instantaneous index-of-refraction field, as well as the resulting optical distortion, to be recorded on a single CCD-image frame. The variable-pressure environment permits changes in Reynolds number without changing the large spatial and temporal scales of the flow. Investigations of these phenomena have been performed on turbulent jets and shear layers, as well as on propagation through slow time-scale, table-top turbulent index-of-refraction fields that allow space- and time-resolved images of the aerooptical distortion from a know source, permitting testing of adaptive-optics ideas.
This is a collaborative project, between Aeronautics, Physics, and Astronomy at Caltech, with parts of this effort undertaken on astronomical facilities, such as the Caltech 200" telescope at Palomar. It is also awaits the development of our in-house, high-resolution, high-speed, digital-imaging technology, designed to address limitations imposed by currently-available digital-imaging capabilities.
[Back to the top]Hydrocarbon combustion
[Back to the top]
Image Correlation Velocimetry
Continuous-field Image Correlation Velocimetry (ICV) determines the optical flow from sequences of images, assuming that the image field represents a convected Lagrangian marker, e.g., a conserved scalar field, or particles, etc. The method extends the original ICV implementation (Tokumaru and Dimotakis 1995), through a hierarchical, multi-resolution B-spline representation that imposes the desired continuity order to the inferred velocity field. It also can accommodate the desired boundary conditions, as appropriate to the flow domain.
The method has been tested on several simulated- and actual-flow cases. Error results were computed, with and without noise added to the correlated test-images. Tests for two laboratory flows, in particular, the flow over an accelerated NACA-0012 airfoil at a high angle of attack and a transverse jet in a coflowing stream were also conducted, with direct-numerical simulations of the flow over the accellerating airfoil by R. Henderson (in progress).
This technique is currently being extended into a full 3D method to capture the full dimensionality of turbulent flow. A previous 3D method, relying on a general linear Least-Squares Mtaching (LSM) technique was developed by S. Deusch (1998), under the supervision of Prof. T. Dracos, at ETH-Zurich, Switzerland.
Development of optical methods that permit the measurement of the convecting velocity field from a succession of images of Lagrangian markers, particle tracers or continuous scalars, e.g. like this 2D image by Laser Induced Fluorescence
GORNOWICZ, G. G. 1997 "Continuous-Field Image-Correlation Velocimetry and its Application to Unsteady Flow over an Airfoil," Aeronautical Engineer thesis, California Institute of Technology.
[References] | [Back to the top]
High-speed, three-dimensional imaging and visualisation of turbulent flows
This part of our effort relies and provides a host of (mostly) in-house-developed digital imaging systems with high framing rate and sufficient pixel number to permit the resolution of the full-range of velocity and scalar scales, in both liquid- and gas-phase flows, for values of the Reynolds number that are of interest to the study of fully-developed turbulent flows. Digital CCD image-array detection, coupled with image-processing methods, make it possible to trace the interface between fluids mixed by turbulence. Such data allow quantitative measures of this process to be computed. We are interpreting the statistical geometric behavior and topology of such interfaces using extensions of the original fractal notions to scale-dependent behavior and other appropriate descriptions. This is important in the context of turbulent mixing, chemical reactions, and combustion, in that such laws permit a calculation of the surface-to-volume ratio of the interfaces on which (molecular diffusion) mixing is taking place, for example, as well as other geometric statistics.
Space-time (x,y,t) LIF image in the far-field (x/d=275) of a liquid-phase (Sc~2000) turbulent (Re=9000) jet (Dimotakis & Catrakis 1996a, Fig. 5.2). Computer visualization by D. Laidlaw.
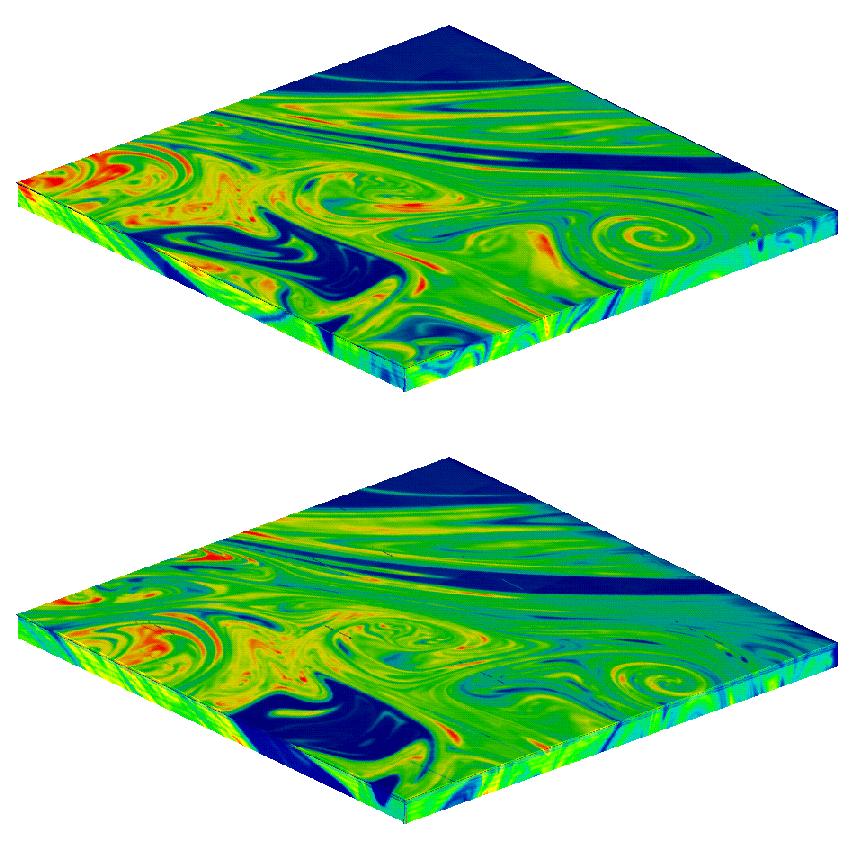
Two time-consecutive (x,y,z) volumes of turbulent jet flow (x/d=250), using 3D LIF-imaging technique [S. Deusch 1998].
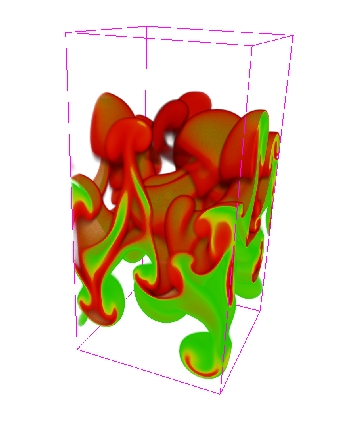
Instantaneous (r=2)-isosurface of a flow (r=3, over r=1) fluid), gravity-driven (Rayleigh-Taylor-instability).
The slightly-transparent interface represents the range of intermediate density values, i.e., 2.7 (green) < r < 3.3 (red). Computer visualisation by S. Deusch.
Additional computer visualizations of this flow by S. Lombeyda.
Riemann-Invariant-Manifold (RIM)
[Back to the top]
Direct numerical simulation (DNS)
[Back to the top]
Dispersion and mixing in high-speed turbulent flows using large eddy simulation with sub-grid scale (LES-SGS) modeling.
The broad range of spatial and temporal scales characterizing most turbulent flows of interest place direct numerical simulation beyond practical reach. Several methods have been developed to obtain approximate solutions that capture the behavior of turbulent flows. Such methods are called turbulence models.
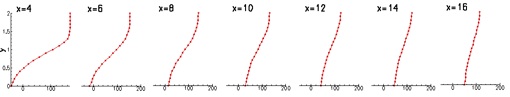
Subsonic flow over a backward facing step: Instantaneous streamwise velocity field on the mid-span plane (top) and average velocity profiles (bottom).
Large-Eddy Simulation (LES) is a category of turbulence models in which the large-scale turbulent motions are resolved whereas the smallest scales are modeled. In our simulations we employ LES with Sub-Grid Scale modeling (LES-SGS) where the effects of scales smaller than those resolved by the simulation are explicitly described by the turbulence model as opposed to relying on the dissipation supplied by the numerical scheme. For this reason, the low numerical dissipation scheme of Hill & Pullin [J. Comp. Phys. 2004 194:435] is used. For the simulation of flows with supersonic regions, the scheme of Hill & Pullin switches to an upwinding WENO method around shock waves from the default centered-differences on a cell-based fashion. The Stretched Vortex LES-SGS model of Pullin et al. [Phys. Fluids 2000 12:1810 and 12:2311] is used to model both momentum and scalar turbulent transport.
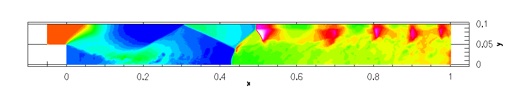
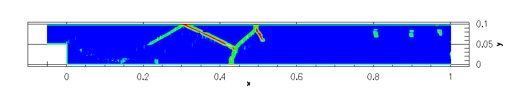
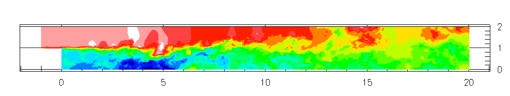
Supersonic flow over a backward facing step: Instantaneous density field on the mid-span plane (top) and WENO coverage (bottom). In the lower panel blue corresponds to the region where the numerical fluxes in all three directions are computed with centered finite differences, green where WENO is used to evaluate the fluxes in one of the dimensions and red in two dimensions. Since the shock waves are not curved in the third spanwise dimension WENO is not used to compute the spanwise fluxes. The cell-based application of the dissipative WENO scheme, and consequently the numerical dissipation, is extremely limited in this turbulent supersonic flow.
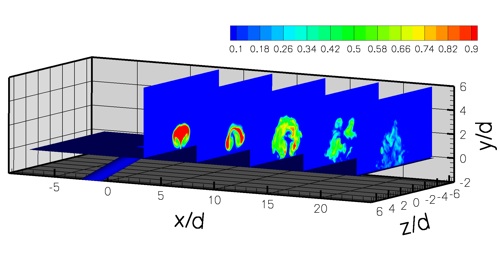
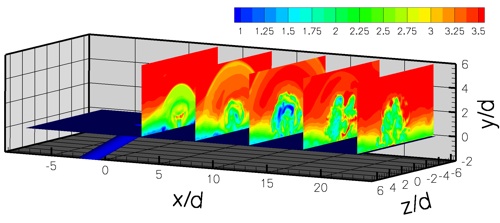
Instantaneous Helium mass fraction contours.
Instantaneous Mach number contours.